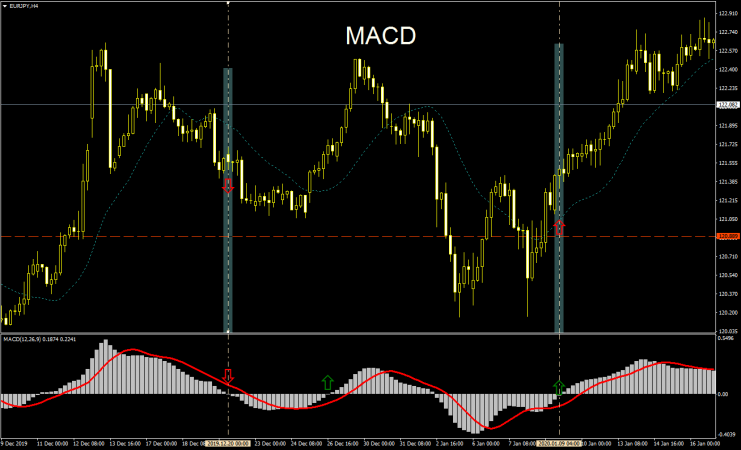
The Moving Average Convergence Divergence (MACD) is an indicator that consists of a histogram and a line. The line is the difference between two exponential moving averages, while the histogram is the difference between the line and a signal line (the exponential moving average of the line). The specifics might sound complicated, but it is an easy-to-read indicator that offers price and momentum signals and also gauges the strength of the current trend.
Usually, it is set up by using the difference between the 12 EMA and the 26 EMA of the price, and the 9 EMA for the signal. These settings can be changed depending on the trader, the asset, the timeframe and the goals.
What do the bars reflect? When the bars start shrinking it means the current trend is losing momentum. If the bars are decreasing within positive ground, the bullish pressure is easing. If the bars are getting smaller in negative ground, it shows the bearish pressure is fading.
A buy signal emerges when the histogram moves away from negative readings and surpasses zero. While a sell signal occurs when it falls below zero. At zero, the two moving averages have the same value. When the MACD line rises above zero it shows a sustained uptrend and below, a downtrend.
The MACD could also be used to determine overbought and oversold conditions. If the MACD moves fast, it means that the short-term EMA is moving away from the long-term one, signaling extreme conditions.The MACD could be combined with RSI and other indicators.


