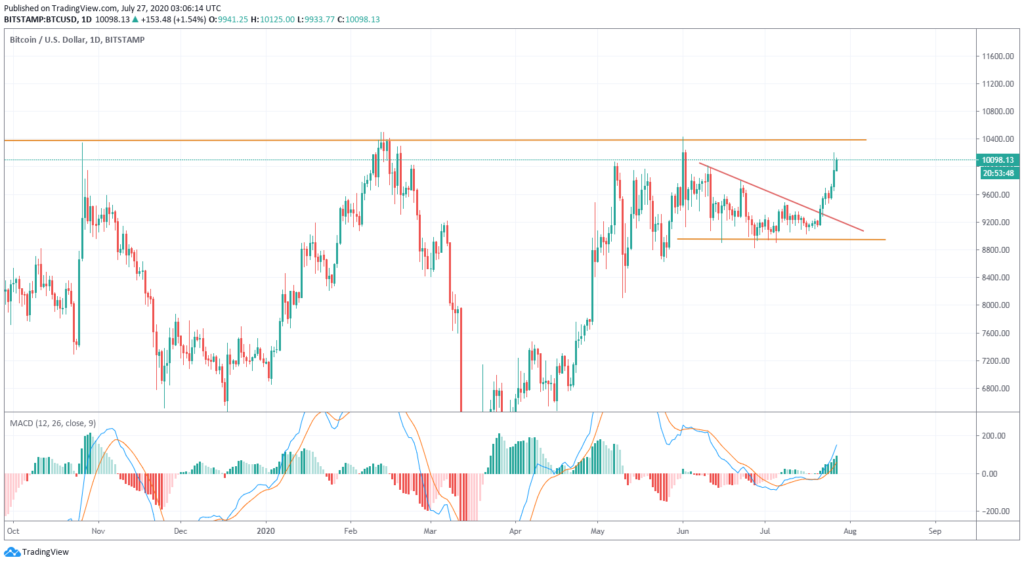
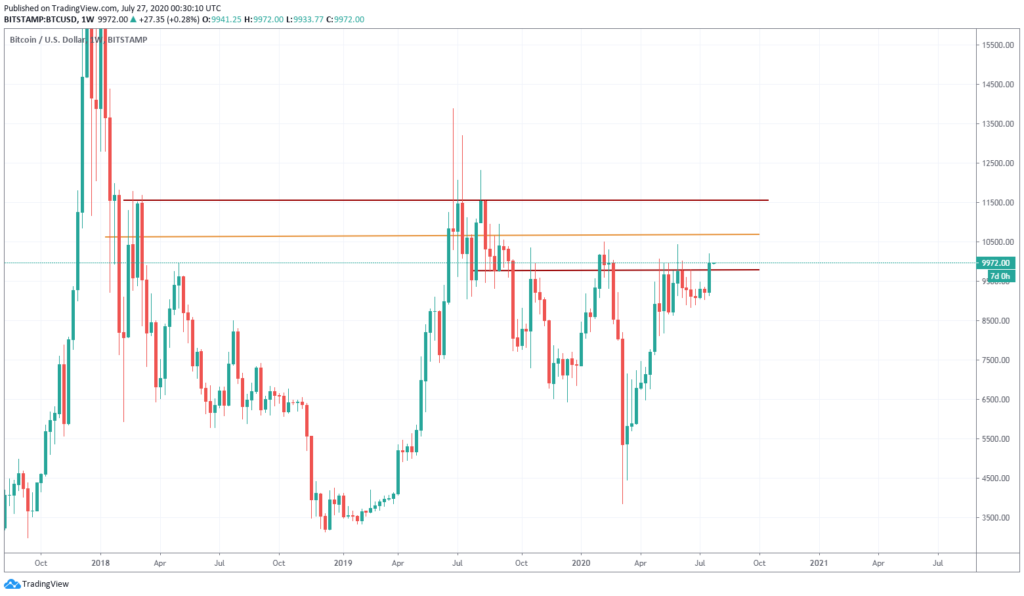
While the US dollar was falling across the board, Bitcoin kept rising, accelerating the rally on Friday. It had the biggest weekly gain since early May (more than 7%). BTC/USD broke a downtrend line, strengthening even further the bullish scenario. The daily and weekly chart presents a set-up favouring more gains. However, a robust resistant band is seen.
The immediate resistance has to do with the $10,000 area. Bitcoin traded above in many occasions during 2020 but failed to consolidate, triggering corrections to $8,700. Now the cryptocurrency it testing levels above the five-figure mark. From a technical and also psychological perspective, it is vital that it remains able to hold solid above.
A bumpy road
The road to more gains has more obstacles ahead that need to be cleared for a rally extension. A range between $10,000 and $10,500 could be considered a resistance band. Technically, a weekly close cleary above $10,500 should point further north. How high could it go in the near-term? The area at $11,000 seems reachable, and above, at $11,100 there is a strong resistance that might be difficult to break.
Another failure of BTC/USD at $10,000 would point to a lack of strength, suggesting price action could remain within the range 10,100 and 8,900 dollars. In the case of a significant close below $8,950, it would likely trigger more losses, potentially reaching $7,600.
Volatility could play an important role ahead. If price climbs cleary above $10,500 it could spark sharp price moves, in both directions. It could be the case that many sell orders are awaiting to be activated near $11,000 or could be the case that a lot of traders expect a clear break above $11,000 to jump on?
The current price level in BTC/USD is relevant: it could spark more gains, suggest lack of strength, it could be a nice level for a reversal and even favour a big jump in volatility. Significant moves in Bitcoin could move the entire cryptomarket.


